Acquisition Services Fund
Financial results by major fund — Acquisition Services Fund
The ASF is a revolving fund that operates from the reimbursable revenue generated by its business portfolios rather than from an appropriation received from Congress. The operations of the ASF are organized into six main business portfolios:
- General supplies and services.
- Travel, transportation, and logistics.
- IT category.
- Assisted acquisition services.
- Professional services and human capital.
- Technology transformation services.
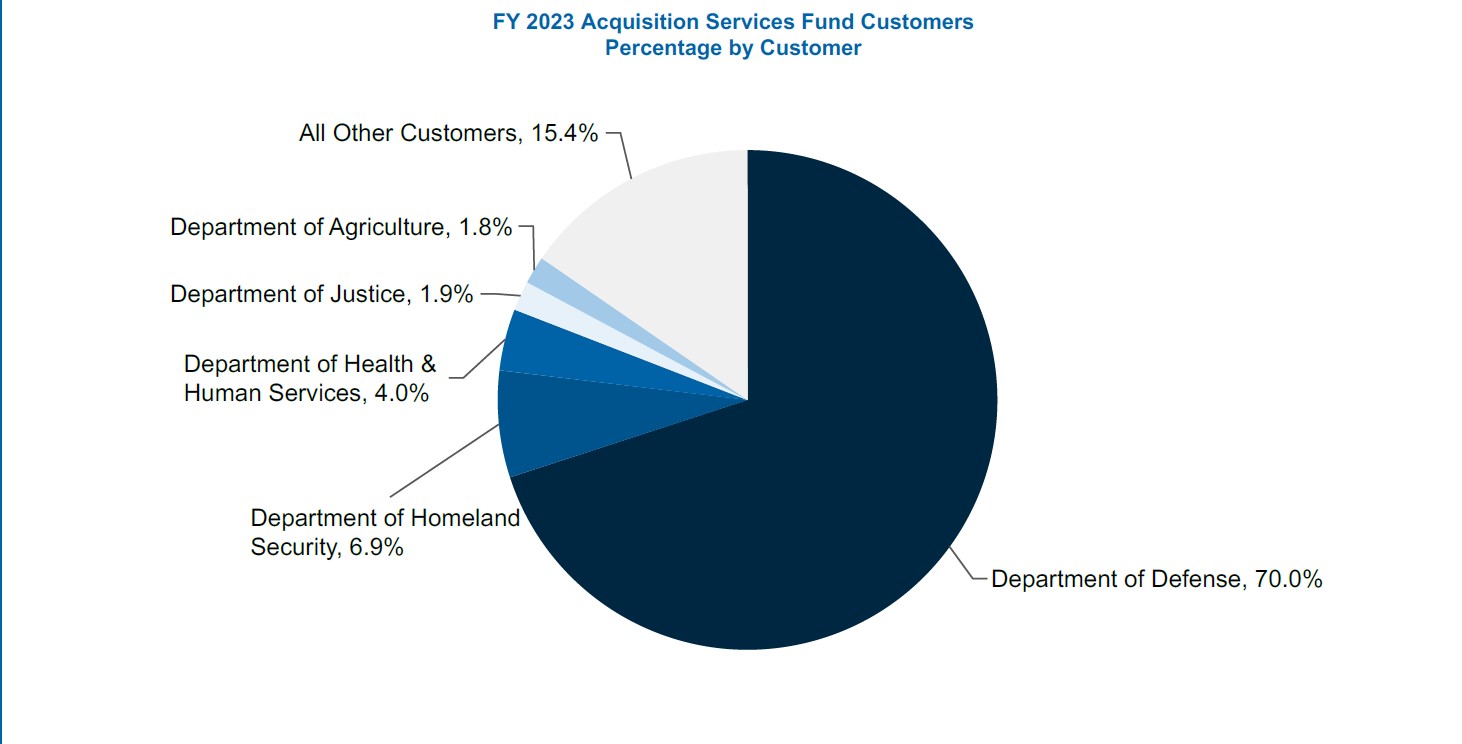
Table 5. ASF Customers (dollars in millions)
| Customers
|
Revenue
|
Percentage of total revenue
|
| Department of Defense
|
$16,050
|
70%
|
| Department of Homeland Security
|
$1,583
|
6.9%
|
| Department of Health and Human Services
|
$914
|
4%
|
| Department of Justice
|
$438
|
1.9%
|
| Department of Agriculture
|
$404
|
1.8%
|
| All other customers
|
$3,530
|
15.4%
|
| Total
|
$22,919
|
100%
|
ASF net revenues from operations
ASF Net Revenue from Operations represent the revenue remaining after deducting the costs of goods and services sold and the cost of operations. In FY 2023, the ASF reported positive financial results, producing net revenues from operations of $417.0 million compared to $333.0 million in FY 2022. AAS programs have continued to experience increased revenue of 12 percent in the past fiscal year, with revenues of $16.9 billion in FY 2023, up from $15 billion in FY 2022, as both the volume and dollar magnitude of goods and services AAS provides increased year-to-year. This increased business volume outpaced the costs necessary to support that business volume and resulted in an increase of $1.9 billion in AAS net revenue compared to FY 2022. The TTL business line increased revenue by $309 million over FY 2022 mainly due to Fleet Leasing and Purchasing. The GS&S business line increased revenue by $365 million from increases in purchases of hardware, office supplies and general products from the GSA schedules reflecting sales above pre-pandemic levels.
Revenue generated from the ITC business line is lower due to the transition to the Enterprise Infrastructure Solutions contract.
ASF obligations and outlays
ASF obligations and outlays are primarily driven by contracts awarded to commercial vendors providing goods and services in support of the ASF program and activities. Due to the increased business volume in the ASF, New Obligations and Upward Adjustments reflected an increase of $3.6 billion between FY 2023 and FY 2022. The total amount of collections continued to exceed disbursements as reflected in Net Receipts from Operating Activities of $68 million.
Table 6. ASF obligations and outlays (dollars in millions)
| Obligations and outlays
|
2023
|
2022
|
Dollar change
|
Percentage change
|
| New obligations and upward adjustments
|
$27,320
|
$23,680
|
$3,640
|
15.4%
|
| Net outlays (receipts) from operating activities
|
$(68)
|
$(280)
|
$212
|
(75.7)%
|
Limitations of financial statements
The principal financial statements are prepared to report the financial position and results of operations, pursuant to the requirements of 31 U.S.C. § 3515 (b). The statements are prepared from the books and records of GSA in accordance with Federal GAAP and the formats prescribed by the Office of Management and Budget. Reports used to monitor and control budgetary resources are prepared from the same books and records. The financial statements should be read with the understanding that they are for a component of the U.S. Government.

 U.S. General Services Administration

