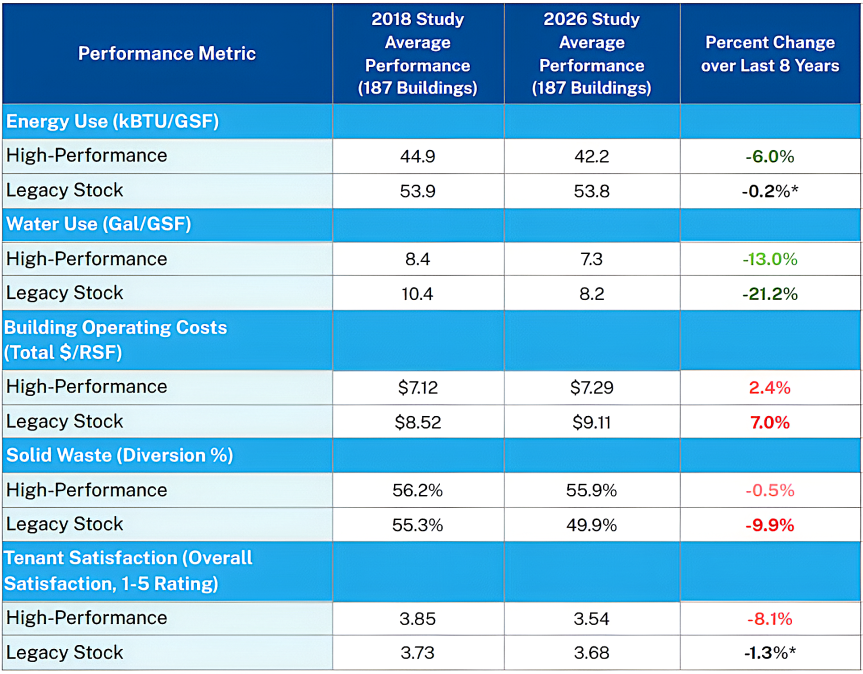
With a significantly larger data set compared to the 100 high-performance and 100 legacy stock buildings in the previous study, it’s difficult to discern changes in performance of the current set of 621 buildings compared to the 2018 results since most of this study’s buildings were not in the 2018 Impact of High-Performance Buildings [PDF - 3 MB] report. Fortunately, 187 buildings (120 high-performance and 67 legacy stock buildings) were included in both studies. The table below compares the performance of these 187 buildings between the 2018 study (using FY15, FY16, and FY17 data) to the most recent FY23 and FY24 dataset to evaluate performance trends over the last eight years.
* means not statistically significant
Compared to 2018, the 187 buildings included in both studies have further reduced energy and water use, but their performance on operational cost (even when adjusted for inflation), waste diversion, and tenant satisfaction decreased since the earlier study. In addition to significant general inflation since the 2018 study, multiple factors — including federal-specific cost drivers — could be increasing overall operating expenses, such as:
- Rising utility rates for energy and water services
- Higher building occupancy and space utilization
- Enhanced security requirements and/or screening operations (e.g. extra staffing and/or more Sensitive Compartmented Information Facility spaces in buildings)
- Increased health and safety requirements in the wake of the COVID-19 pandemic, such as higher ventilation rates, increased water flushing, and indoor environmental quality monitoring
- Mandatory use of socioeconomic contracts, limiting competition that typically drives down prices
- A general shift to more-expensive contracted versus internal subject matter expertise for complex building systems and enhanced performance tracking
The decrease in the waste diversion rate may be due to a decrease in the quantity of recyclable materials (such as paper) generated at GSA managed buildings, fluctuations in the recycling market, and availability of local recycling services. Similar to increases in cost, reductions in reported tenant satisfaction could be driven by higher building occupancy. Further analysis could explore how operational changes, performance measure priorities, different federal requirements, occupancy changes, and industry trends have contributed to these mixed results over the last decade.

 U.S. General Services Administration