The Energy Independence and Security Act of 2007 (EISA) recognized a high-performance building as one that “integrates and optimizes on a life cycle basis all major high performance attributes, including energy conservation, environment, safety, security, durability, accessibility, cost-benefit, productivity, sustainability, functionality, and operational considerations.” In 2020, under the first Trump Administration, the White House Council on Environmental Quality overhauled the Guiding Principles for Sustainable Federal Buildings (Guiding Principles) to help federal agencies more efficiently follow the law while maximizing savings in the design and operation of America’s federal buildings.
The Guiding Principles streamline multiple legal mandates into practical checklists for new buildings, major renovations, and existing buildings. The criteria allow agencies to efficiently follow laws and policies requiring them to reduce operating costs, improve resource efficiency, and provide safe, healthy, and productive environments for American workers.
In this study, “high-performance” buildings are federally-owned, GSA-managed buildings that meet the Guiding Principles. “Legacy stock” buildings are federally-owned, GSA-managed buildings that have been evaluated and do not meet the Guiding Principles.
Not all high-performance buildings are new. Many historic and other older buildings meet the Guiding Principles and are included in this study. The average age of buildings in this study is just over 60 years. Within GSA’s eligible portfolio in FY 2024, 39% of GSA’s owned buildings, and 51% of GSA’s owned gross square footage, qualified as high-performance.
Our study approach
This study used the following steps to compare the performance of GSA’s high-performance buildings against GSA’s legacy stock buildings and industry-accepted benchmarks. The approach follows the method used in our 2018 study, with some adjustments in Step 2 to include more buildings in our analysis.
Step 1. Gather building performance data
Agencies report which buildings meet the Guiding Principles each year through the Federal Real Property Profile Management System (FRPP). This study started with all GSA-owned buildings for which FRPP’s “Sustainability Status” data element was coded as either “Yes” or “No” in the FY24 FRPP. This is the set of buildings that had been evaluated and confirmed to either meet — or not meet — the Guiding Principles. The “Yes” buildings are categorized as high-performance for purposes of this study, and the “No” buildings are categorized as legacy stock.
GSA then collected FY 2023 and 2024 performance data for five metrics:
- Energy use
- Water use
- Building operating expenses
- Solid waste diversion
- Tenant satisfaction
These data cover two fiscal years, from October 1, 2022 through September 30, 2024. GSA collected building-specific data from the systems in the table below.
| Measure | Performance Metric | Measurement Unit | GSA System of Record |
|---|
| Energy Use | Energy Use Intensity | Thousand British thermal units (Btu) of energy used per gross square foot (GSF) | Metering Utilities Stewardship Energy (MUSE) Envizi |
|---|
| Water Use | Water Use Intensity | Gallons of water used per GSF | Metering Utilities Stewardship Energy (MUSE) Envizi |
|---|
| Waste Diversion | Waste Diversion | Percent of waste diverted from landfill by recycling | Metering Utilities Stewardship Energy (MUSE) Envizi |
|---|
| Building Operating Expenses | O&M Expenses | Dollars per rentable square foot (RSF) for mechanical operation and maintenance (O&M) | Financial Management Information System (FMIS) |
|---|
| Cleaning Expenses | Dollars per RSF for cleaning |
| Utility Expenses | Dollars per RSF for all utilities, including electricity, gas, oil, water, and steam |
| Tenant Satisfaction | Average Tenant Satisfaction | Likert scale rating (1-5) for indoor air quality, noise, temperature, cleanliness, light, and overall satisfaction | Tenant Satisfaction Survey |
|---|
Step 2. Define the building set
From this initial list, we omitted buildings with data availability or comparability issues, such as:
- Unique building types with small sample sizes and/or unusual operating characteristics, such as Data Centers, Laboratories, Warehouses, and Museums.
- Buildings that GSA owns but other federal agencies operate (“delegated” buildings), where data availability was limited.
This study focuses on GSA-owned and managed Office Buildings, US Courthouses, and Land Ports of Entry (LPOEs, or border stations). About 82% of GSA-owned and managed facilities are in these categories, based on October 2024 portfolio metrics published by the Public Building Service.
LPOEs were evaluated for operating cost and tenant satisfaction, but not for energy, water, and waste, because GSA tracks that data for entire multi-building LPOE campuses instead of by specific building. LPOEs also tend to have small footprints, extensive site lighting, and 24/7 operational needs. A later study could investigate LPOEs for energy, water, and waste performance at the campus/facility level.
After gathering the data, the team reviewed it for completeness and included buildings in the analysis if they had at least one full fiscal year of data for any metric. For example, if a building had one or two full fiscal years of data for energy and water, but not for waste, building operating expenses, or tenant satisfaction, then the building was included in the analysis of energy and water performance, but not the metrics that lacked adequate building-specific data.
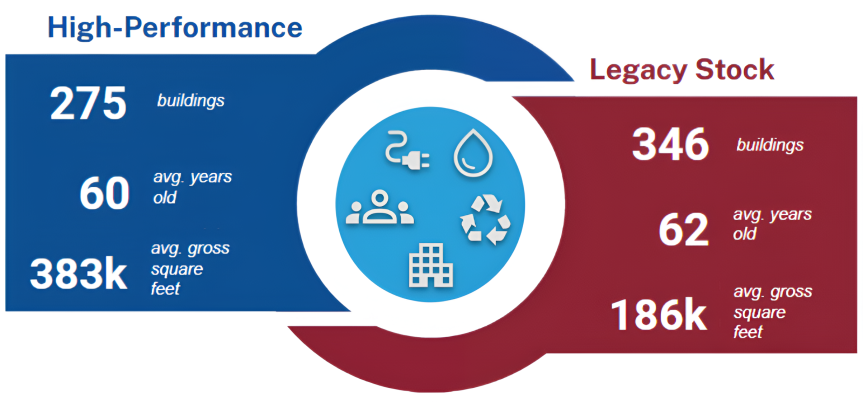
Overall, we included a total of 621 buildings in this study: 275 high-performance buildings and 346 legacy stock buildings. Of those, 296 buildings had complete data for all five measures (172 high-performance buildings and 124 legacy stock buildings). Although the high-performance buildings tended to be larger, both sets had average building ages of at least 60 years. The study represents nearly 170 million square feet of total building area, with both types of buildings distributed across GSA’s nationwide portfolio.
Step 3. Execute analysis and identify industry benchmarks
In addition to comparing GSA’s high-performance and legacy stock buildings, GSA also compared both types against industry-accepted office building benchmarks for every key metric that has current industry benchmark data available. Industry benchmarks were available for energy use, water use, and tenant satisfaction.
| Measure | Performance Metric | Industry Benchmark |
|---|
| Energy Use | Energy Use Intensity | Department of Energy (DOE), Energy Information Administration (EIA) Commercial Buildings Energy Consumption Survey (CBECS) 2018 |
|---|
| Water Use | Water Use Intensity | ENERGY STAR® Portfolio Manager 2023 |
|---|
| Tenant Satisfaction | Average tenant satisfaction | Occupant Indoor Environmental Quality Survey 2021 |
|---|


 U.S. General Services Administration