An official website of the United States government
Here’s how you know
Official websites use .gov
A .gov website belongs to an official government organization in the United States.
Secure .gov websites use HTTPS
A lock
()
or https:// means you’ve safely connected to the .gov website. Share sensitive information only on official, secure websites.
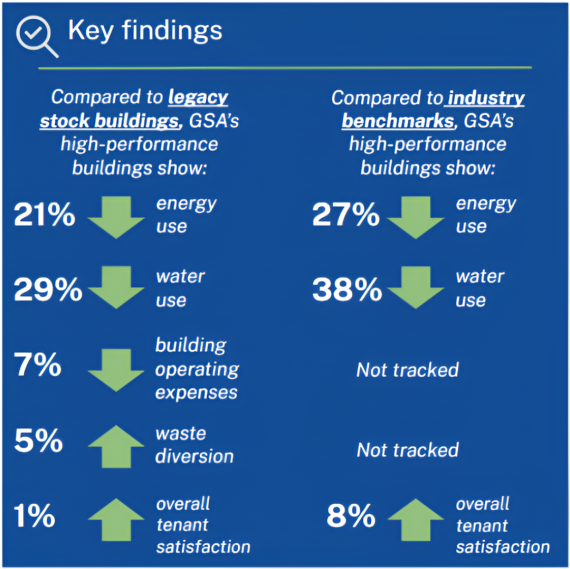
This study examines five building metrics: energy use, water use, building operating expenses, solid waste diversion, and tenant satisfaction. For each metric, it compares GSA’s high-performance buildings against legacy stock and industry standards (where available). Results shown are the two-year (FY23 & FY24) average values for each metric. Similar to the 2018 study, high-performance buildings outperformed all available industry benchmarks.
Buildings account for about 40% of total energy use and 75% of electricity use in the U.S.— more than the industrial or transportation sectors (National Laboratory of the Rockies, 2026). This is likely to increase in coming years, as commercial data centers are rapidly growing to support AI computing and are projected to account for up to 12% of total U.S. electricity consumption by 2028 (Lawrence Berkeley National Laboratory, 2024). Reducing the energy use of our buildings has many benefits:
Minimizing costs (and saving taxpayer dollars, for government buildings)
Mission assurance, continuity of services, and facility flexibility and durability, e.g. through smart building technologies
Improved reliability and longevity of the electric grid
Promoting American energy independence
Supporting innovative American-made technologies
Cleaner air and water and healthier communities
GSA continually invests to maximize the energy efficiency of its buildings, which saves money both on monthly utility bills and by reducing the size and cost of equipment. Opportunities for increasing building efficiency include upgrading equipment and energy management systems, testing and tuning equipment and systems (commissioning), and applying modern high-performance building design practices. GSA’s High-Performance Building Clearinghouse provides many more strategies for improving energy efficiency in buildings.
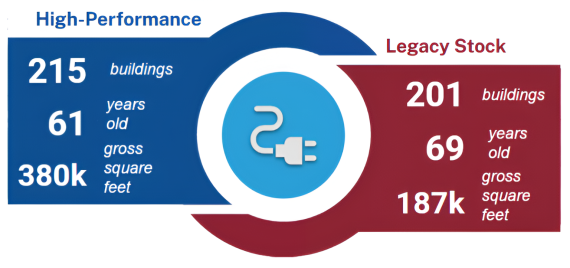
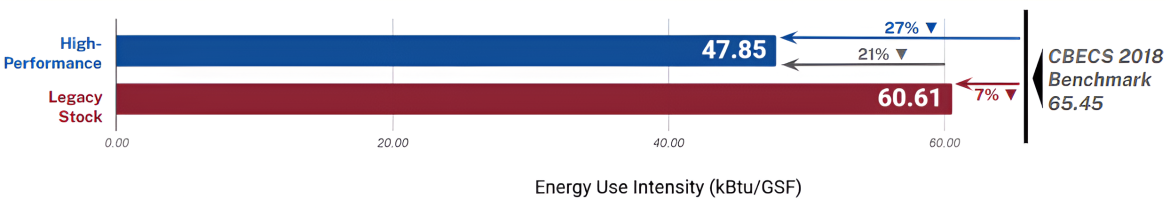
FY 2023–2024 energy consumption data for each building in the analysis was converted to British Thermal Units (Btu), then expressed in terms of energy use intensity (EUI), or average consumption per gross square foot per year. Energy use intensity is typically measured in thousands of Btu, or kBtus, per gross square foot per year. The results indicate that GSA’s high-performance buildings are more energy efficient than both legacy stock buildings and commercial office building counterparts.
Specifically, over a two-year average:
High-performance buildings’ EUI was 21% lower than GSA’s legacy stock buildings
High-performance buildings’ EUI was 27% lower than the CBECS benchmark
Legacy stock buildings’ EUI was 7% lower than the CBECS benchmark
High-performance buildings used 12.8 kBtu less energy per gross square foot than legacy stock buildings
High-performance buildings used 17.6 kBtu less energy per gross square foot than the CBECS Benchmark
The average EUI of GSA’s high-performance buildings is 47.85 kBtu/GSF, while the average EUI of GSA’s legacy stock buildings is 60.61 kBTU/GSF.
If an average-sized legacy stock building were as energy efficient as GSA’s high-performance buildings, one building alone would save 3.3 billion Btus annually. This is equivalent to the annual energy usage of 43 average American homes (U.S. Energy Information Administration, 2020), and could save taxpayers on average over $120,000 per building per year. If all of GSA’s legacy stock buildings in this study operated as efficiently as our high-performance buildings, energy savings alone would add up to over $21 million per year based on GSA’s national average energy costs.
The federal government collectively spent almost $700 million in FY24 on water and sewer services for buildings (U.S. Department of Energy, 2024). Implementing water conservation measures is a growing priority, due to increasing water demand and regional scarcity, and rising costs of water.
Building-related water efficiency efforts seek to reduce water consumption and related expenses without sacrificing water quality, occupant needs, or building performance. Building water use includes both indoor water use, such as plumbing fixtures and large building mechanical equipment such as evaporative cooling towers, as well as outdoor water use, such as irrigation systems. The Environmental Protection Agency’s “WaterSense at Work” publications compile many best management practices for saving water and money in government, commercial, and institutional buildings.
Saving water has many benefits:
Minimizing water and sewer costs (and saving taxpayer dollars, in the case of government buildings)
Reducing energy needed to treat, pump, heat, and/or cool water in buildings
Reducing costs and stress on sewer and water treatment infrastructure
Reducing the impacts of drought and water scarcity, while freeing up more water for other users, including American farmers, homes, streams, and wetland ecosystems.
Paying close attention to water usage patterns and trends may reveal infrastructure problems such as faulty equipment
Water Data Results
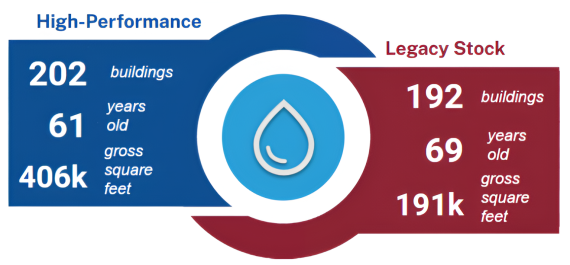
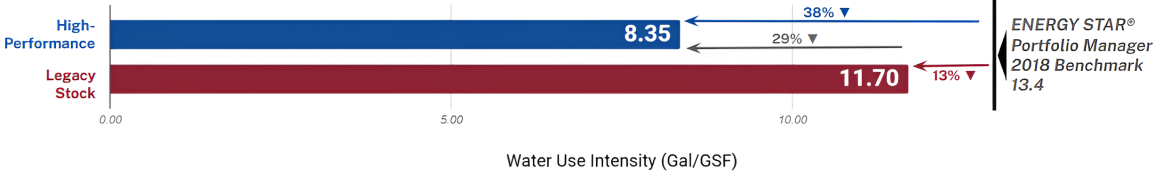
Water use for each building is represented as water use intensity (WUI), calculated as the total gallons consumed per gross square foot of space (Gal/GSF). These results demonstrate that GSA’s high-performance buildings are more water efficient than both GSA’s legacy stock buildings and average commercial office buildings.
Based on these findings, if a hypothetical average-sized legacy stock building were as water-efficient as GSA’s high-performance buildings, one building alone would save 620,000 gallons annually compared to a legacy stock baseline — almost enough to fill an olympic-size swimming pool. Water cost savings opportunities could exceed $3 million per year if all legacy stock buildings included in this study were to match the WUI of GSA’s high-performance buildings.
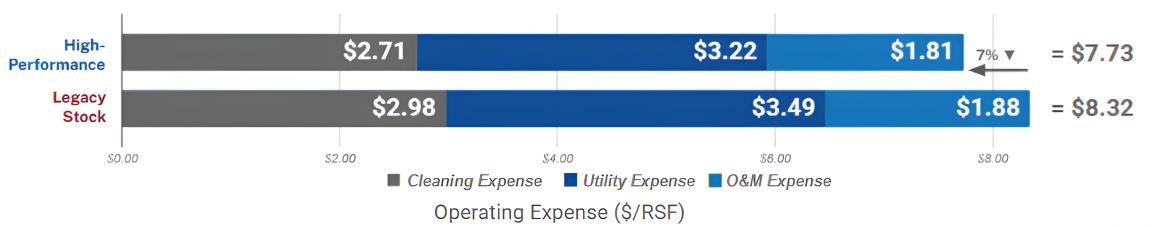
Building operating expenses are the costs associated with keeping a building maintained and functional. GSA collected available data for the following three categories, which comprise most of a building’s regular operating costs:
Operations and Maintenance (O&M) expenses: services that keep buildings in working order, such as regular mechanical equipment maintenance and general building upkeep
Cleaning expenses: cleaning the building, maintaining its grounds, taking out waste, and removing snow
Utility expenses: total building utility costs, including electricity, natural gas, water, and steam
Building operating costs were calculated as total dollars per rentable square foot for the three cost categories above. High-performance buildings outperformed GSA’s legacy stock buildings in all building operating expense categories. On average, high performance buildings saved $.60 per RSF in total annual operating expenses. GSA was unable to identify a current and appropriate industry-recognized benchmark for building operating expenses.
For individual expense categories, on average:
High-performance buildings cost $0.27 less per rentable square foot in cleaning expenses, $0.27 less per rentable square foot in O&M expenses, and $0.07 less per rentable square foot in utility expenses, compared to GSA’s legacy stock.
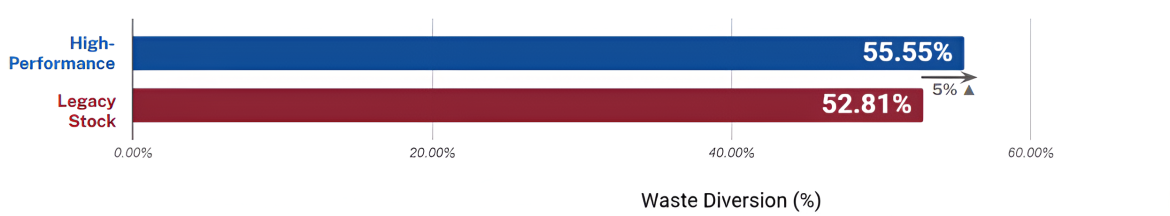
Municipal solid waste (MSW) generated by building occupants, operations, and small modernization activities is disposed into refuse bins and hauled away in the form of landfilled waste or diverted recycling. MSW disposal costs are incurred by property owners and frequently passed on to tenants. Waste diversion reduces MSW hauling expenses, or can even generate revenue, since some waste management firms remove recycled materials for a discounted or nominal cost, or pay building owners like GSA for the value of recycled materials. The U.S. Environmental Protection Agency tracks the national average costs that landfills charge for waste disposal, known as tipping fees. Since the 2018 study, the national weighted average tipping fee has increased by nearly 17% to $57.63 per ton. The 361 buildings with available waste data in this study generated over 21,000 tons of solid waste in FY24, representing over $1.2 million dollars per year in waste hauling expenses, if all the MSW materials were landfilled (The Environmental Research & Education Foundation, 2023).
GSA collects solid waste and waste diversion data for buildings in its inventory. The figure below shows the percentage of MSW diverted from landfills for high-performance buildings and legacy stock buildings. High-performance buildings must maintain annual waste diversion rates of at least 50%. Both GSA’s high-performance and legacy stock buildings exceeded this target in FY23 and FY24, with high-performance buildings diverting 5% more solid waste compared to legacy stock buildings. GSA was unable to identify an industry-recognized benchmark for waste diversion percentage. In FY23 and FY24, high-performance buildings cumulatively saved over $826,000 in waste disposal fees based on the national tipping fee average, assuming cost avoidance by diverting materials from landfills.
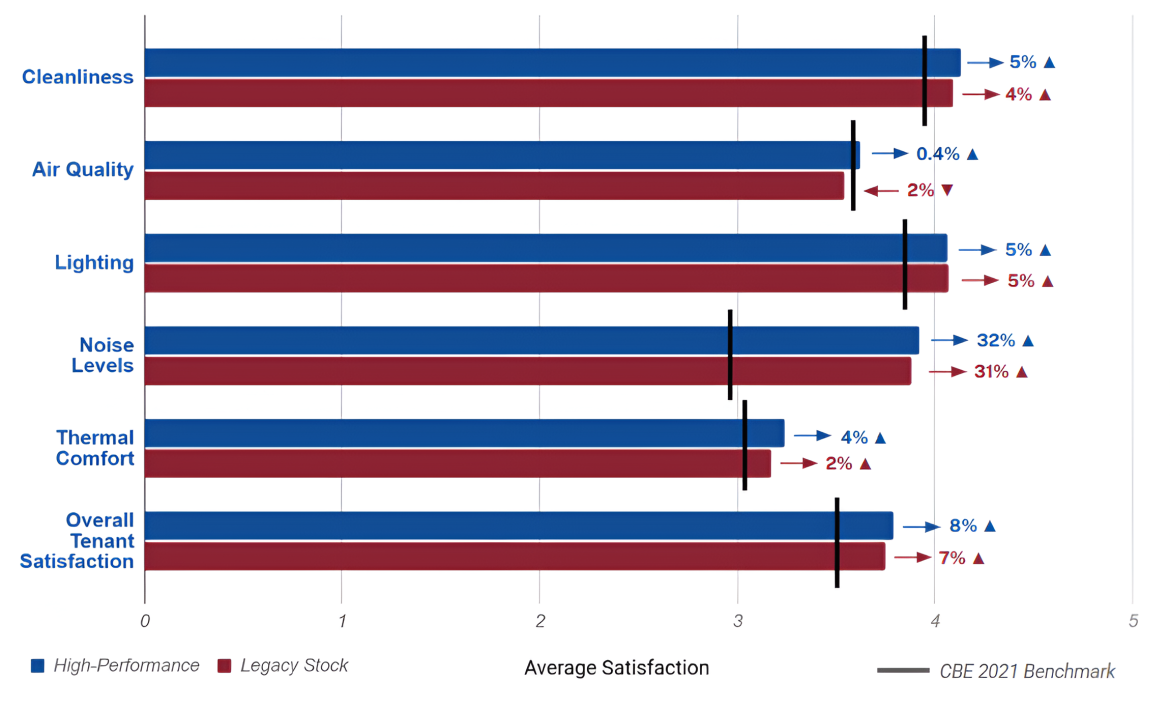
GSA administers a Tenant Satisfaction Survey (TSS) to all federal employees in GSA-owned and leased buildings annually. The survey’s goal is to assess satisfaction with the building and how it is managed. Tenants are asked to rate their level of satisfaction with building cleanliness, indoor air quality, lighting, noise levels, and thermal comfort on a scale of one to five, with five being most satisfied. For a comparative benchmark, GSA used the Occupant Indoor Environmental Quality Survey from the Center for the Built Environment (CBE) at the University of California in Berkeley.
The figure below illustrates average tenant satisfaction ratings across five major TSS categories for high-performance and legacy stock buildings for FY 2023–2024, as well as the CBE benchmark. CBE’s Occupant Indoor Environmental Quality Survey utilizes a numerical likert scale from 1-7 compared to GSA’s 1-5 rating for the TSS. CBE’s benchmark values were adjusted downward to fit within the 1-5 rating scale for comparison to the TSS scores.
TSS responses for occupant comfort and building features show that high-performance buildings have average satisfaction rates for all metrics that are equal to or greater than legacy stock buildings.
The relative performance of high-performance buildings in the categories of lighting and noise levels has improved since the 2018 version of this study was completed.
GSA’s high performance buildings exhibit higher average overall satisfaction across all categories compared to CBE benchmarks.
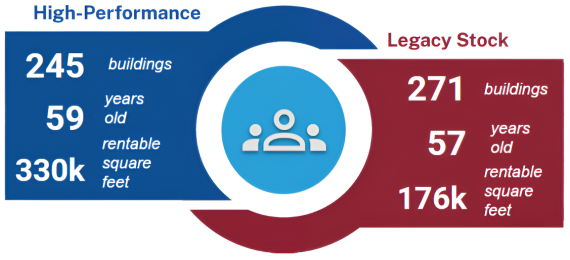
High-performance buildings provide clear operational savings compared to GSA’s legacy stock buildings. GSA extrapolated the results to estimate the additional annual cost savings that could be realized if the legacy stock buildings in the dataset were upgraded (e.g. with more efficient equipment selections and operational practices) to perform at the same level as the high-performance buildings. The table below shows the projected annual savings in a scenario where the 346 legacy stock buildings in the data set matched the efficiency of GSA’s high-performance buildings.
Performance Metric
Current Actual & Estimated Costs (all 621 buildings)
Projected Cost if All 621 Buildings were High-Performing
Potential Annual Savings in Legacy Stock Buildings
Energy
$234,282,689
$212,635,852
$21,646,837
Water
$29,140,947
$25,913,201
$3,227,746
Building Operating Expenses (Cleaning & Mechanical)
$814,887,860
$757,674,877
$57,212,983
Solid Waste
$542,010
$529,753
$12,257
Total
$1,078,853,506
$996,753,683
$82,099,823
From these findings, if the 346 legacy stock buildings performed at the same level as GSA’s high-performance buildings, GSA could save over $82 million annually. Upgrading legacy stock buildings to meet the Guiding Principles could be accomplished through a combination of funding sources, including appropriations and monies from the Federal Buildings Fund that GSA maintains, grants, and public-private partnerships such as energy savings performance contracts (ESPCs) and utility energy service contracts (UESCs). GSA building teams have also demonstrated the ability to make significant performance improvements through low- and no-cost operational measures, including by adjusting temperature setpoints, repairing air and water leaks, installing occupancy sensors and smart power strips, maximizing daylighting, and implementing preventive maintenance plans to ensure efficient building operations.
PER DIEM LOOK-UP
1
Choose a location
Error, The Per Diem API is not responding. Please try again later.
No results could be found for the location you've entered.
Get my location
OR
OR
Rates for Alaska, Hawaii, and U.S. territories and possessions are set by the Department of Defense.
Traveler reimbursement is based on the location of the work activities and not the accommodations,
unless lodging is not available at the work activity, then the agency may authorize the rate where
lodging is obtained.
Unless otherwise specified, the per diem locality is defined as "all locations within, or entirely
surrounded by, the corporate limits of the key city, including independent entities located within
those boundaries."
Per diem localities with county definitions shall include"all locations within, or entirely
surrounded by, the corporate limits of the key city as well as the boundaries of the listed counties,
including independent entities located within the boundaries of the key city and the listed counties
(unless otherwise listed separately)."
When a military installation or Government - related facility(whether or not specifically named) is
located partially within more than one city or county boundary, the applicable per diem rate for the
entire installation or facility is the higher of the rates which apply to the cities and / or counties,
even though part(s) of such activities may be located outside the defined per diem locality.

 U.S. General Services Administration